League 1 update: 17 Jan 2015

Football League data analysis, visualisations and insight blog ‘Experimental 3-6-1’ has provided their latest League One graphics showing how each team is performing. The graphics show Swindon Town’s dominance in attack, but highlights Town’s defence needs to increase its effectiveness if we are to sustain our push for promotion…
Following Saturday’s matches I’ve updated my scatter graphics to see how each of the four divisions below the Premier League are looking. For each division there are three graphics – the first shows overall dominance, the second attacking performance and the third defensive performance. All are based on shot data and give a high-level view of how each club is doing relative to the others, with the axes centred on the divisional average.
Here we look at League 1, starting with each club’s overall dominance. Shots taken are on the horizontal and shots faced are on the vertical, so bottom right is good while top left is bad:
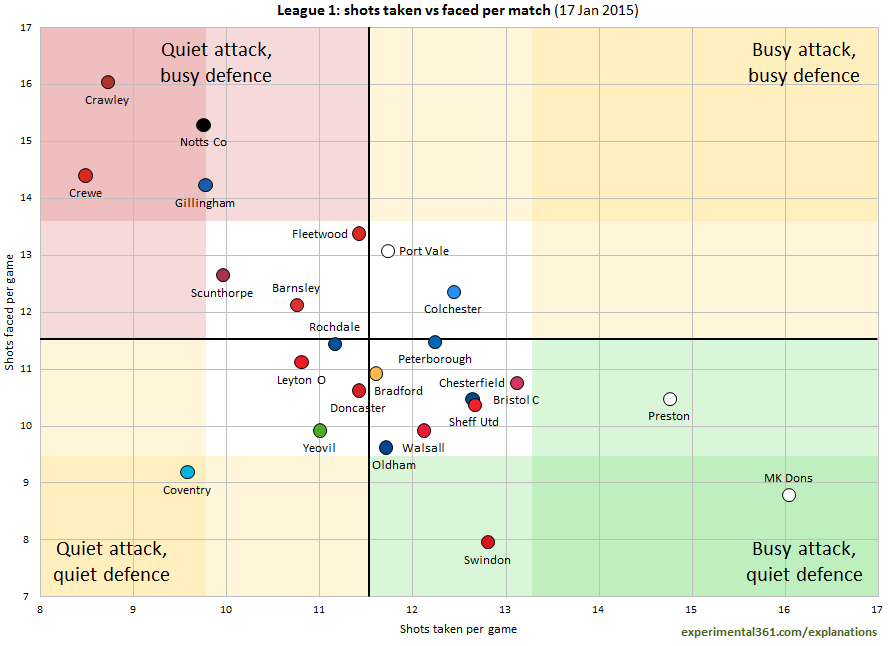
MK Dons are the most dominant side in the division, although Preston and Swindon also spend plenty of time in charge. Despite their top half position, Notts County have been under the cosh to an extent that might be expected of relegation candidates, while
View original post 169 more words


Can you correlate your first graph against league position somehow?! My head says no. But there must be a way…
LikeLike